
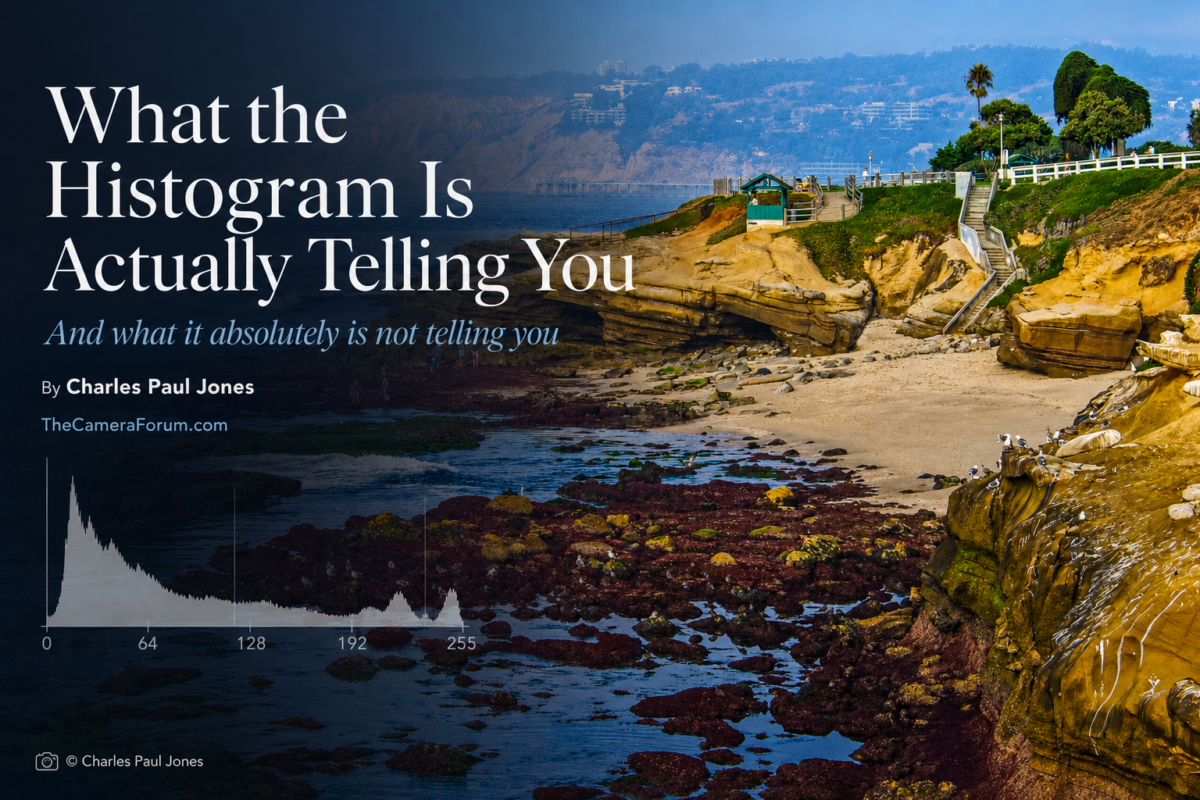
And what it absolutely is not telling you
By Charles Paul Jones
TheCameraForum.com
A friend whose photographic eye I greatly respect posted something on Facebook today about histograms. He was pushing back against one of the oldest misunderstandings in digital photography.
He was right.
He was also wrong. I think a bit confused, as it is a confusing subject.
Both things deserve to be said plainly, because this is exactly how photographic confusion survives for decades. Somebody says something simple and wrong. Somebody else corrects it with something complicated and also wrong. Then the rest of us spend the next twenty years arguing over the wreckage.
The original misconception is the one most of us have heard:
A histogram loaded to the left means the photograph is underexposed.
A histogram loaded to the right means the photograph is overexposed.
No. Not necessarily. Not even close.
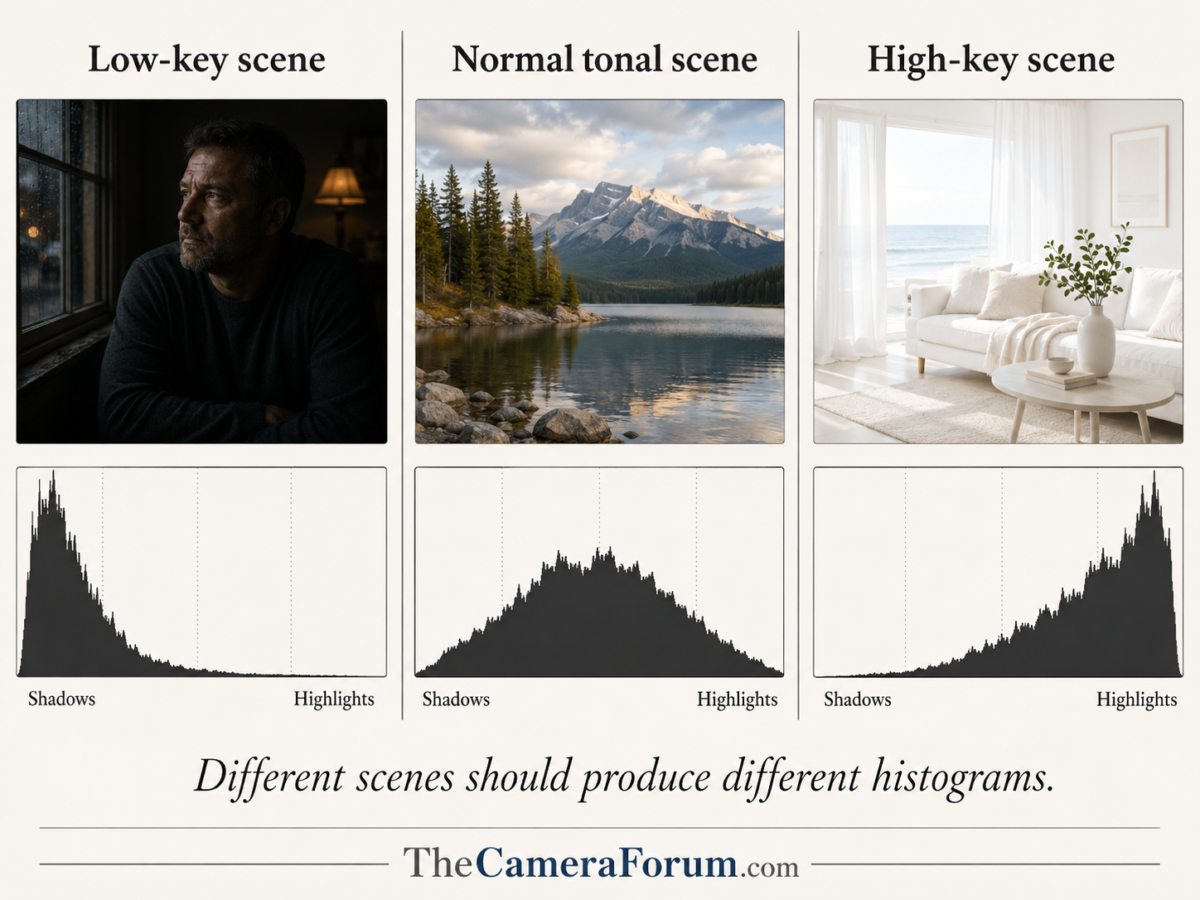
A low-key portrait of a man in a black coat against a black background should have a histogram piled up on the left. A photograph of snow in morning light should have a histogram pushed toward the right. Neither one is automatically wrong. The histogram is not a judge. It is not an art critic. It is not your mother-in-law.
It is a graph.
It describes what is in the file.
It does not tell you whether the photograph is any good.
Then my friend reached for the Zone System to explain why.
That is where the wheels came off.
His claim was that the histogram represents nine of the eleven zones of the Zone System, with Zone V sitting at the center of the histogram. He also suggested that because modern cameras may have fourteen or more stops of dynamic range, the curve can extend “at least five EV past the left edge” of the histogram without losing information.
That is not how this works.
Actually, that is not how any of this works.
The Histogram Shows You What Got Recorded
A histogram is a graph of pixel values present in an image file.
That is all it is.
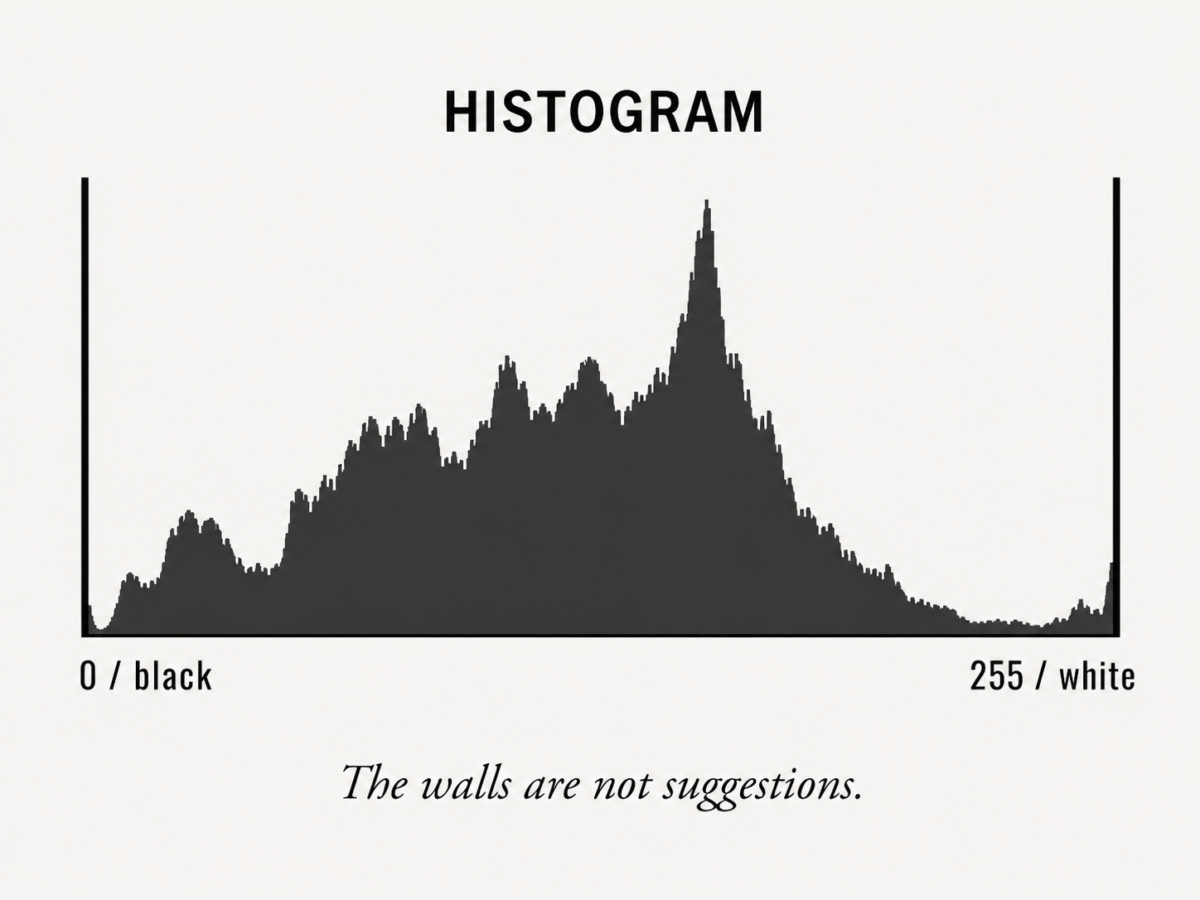
The horizontal axis represents the range of values the file can display. In a standard 8-bit display histogram, that runs from 0 on the left to 255 on the right. Zero is black. Two hundred fifty-five is white. Everything else lives between those two walls.
Yes, RAW files are deeper than 8-bit JPEGs. Yes, modern sensors can capture an impressive range of brightness. Yes, software maps all of that into a visual histogram you can understand.
But here is the part people seem determined to turn into mythology:
There is no secret photograph hiding five stops to the left of the histogram.
There is no magic drawer of shadow detail sitting outside the graph.
There is no tonal wilderness beyond the wall where your lost pixels are waiting patiently for Lightroom to rescue them.
The histogram is not a little window looking at part of the file.
The histogram is a description of the file.
When the data piles up against the left wall, some part of the image may be clipped to black. When the data piles up against the right wall, some part of the image may be clipped to white.
The walls are walls.
Not suggestions.
Not guidelines.
Not artistic opportunities.
Walls.
A sensor’s dynamic range determines how much of the real-world scene can be captured before something has to give. If the scene fits inside what the sensor can record, wonderful. If it does not, you make a choice. You protect the highlights. You protect the shadows. You bracket. You light the scene. You come back tomorrow. You make a photograph out of the conditions you actually have.
But the dynamic range does not live outside the histogram.
It lives inside the file.
And the histogram is telling you what made it into that file.
Zone V Does Not Live in the Middle of the Histogram
The Zone System is one of the great gifts of photographic thinking. Ansel Adams and Fred Archer gave photographers a way to previsualize tones in the scene and control where those tones would land in the finished print.
That matters.
But the Zone System is scene-referred.
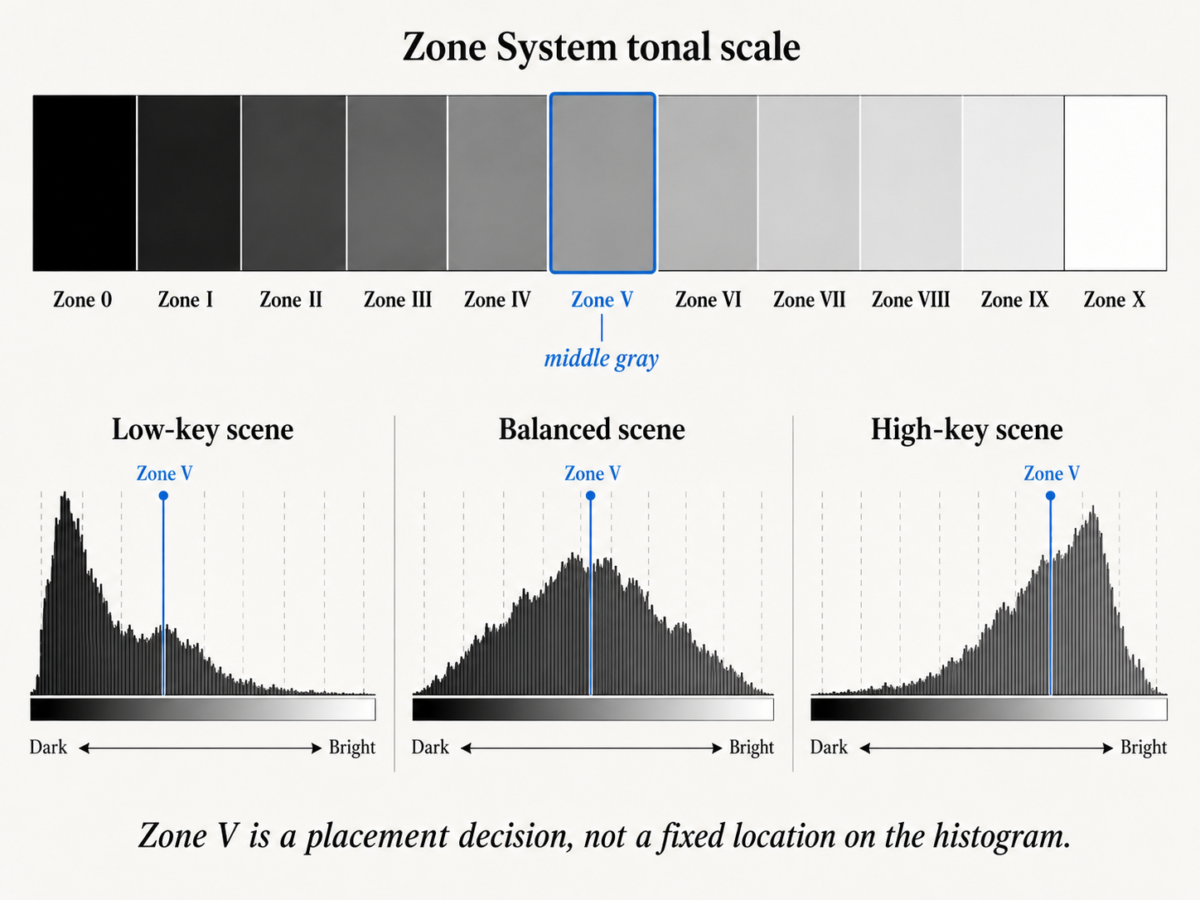
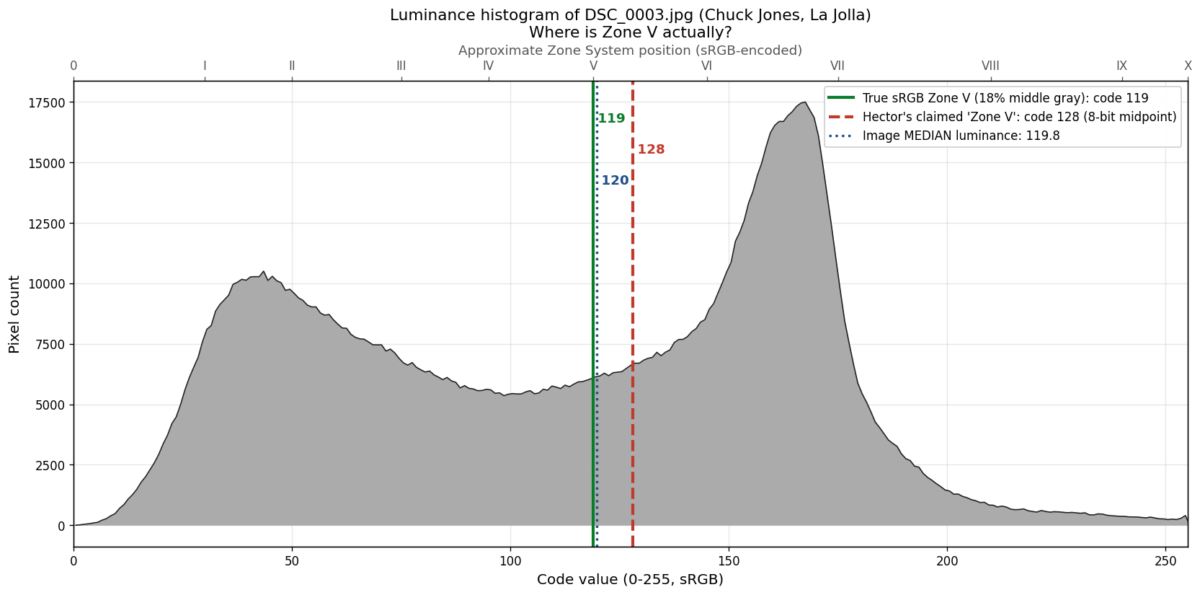
Zone V is middle gray. Roughly 18 percent reflectance. It is a way of thinking about the brightness of the world in front of your lens and deciding where you want that brightness to fall in the final image.
Zone V does not live at the center of the histogram.
Zone V lives wherever your exposure puts it.
If you photograph snow and expose so the snow falls on Zone VII or Zone VIII, then middle gray is not the star of the show. If you photograph a dark doorway in New Mexico and place the shadow detail around Zone III, the histogram is going to look very different. If you photograph a black dog in a coal bin at midnight, God help you, but the histogram will do exactly what the file tells it to do.
The histogram has no idea what Zone V is.
It does not know what you saw.
It does not know what you intended.
It does not know whether the subject was black velvet, white adobe, red chile, chrome, skin, snow, or the back wall of a bad motel room in Barstow.
It only knows the pixel values in the file.
The map is not the territory.
And the histogram is not the Zone System.
The Real Reason “Expose to the Right” Exists
Now, there is a legitimate reason photographers learned to distrust the histogram on the back of the camera.
This is where the confusion gets a little more interesting.
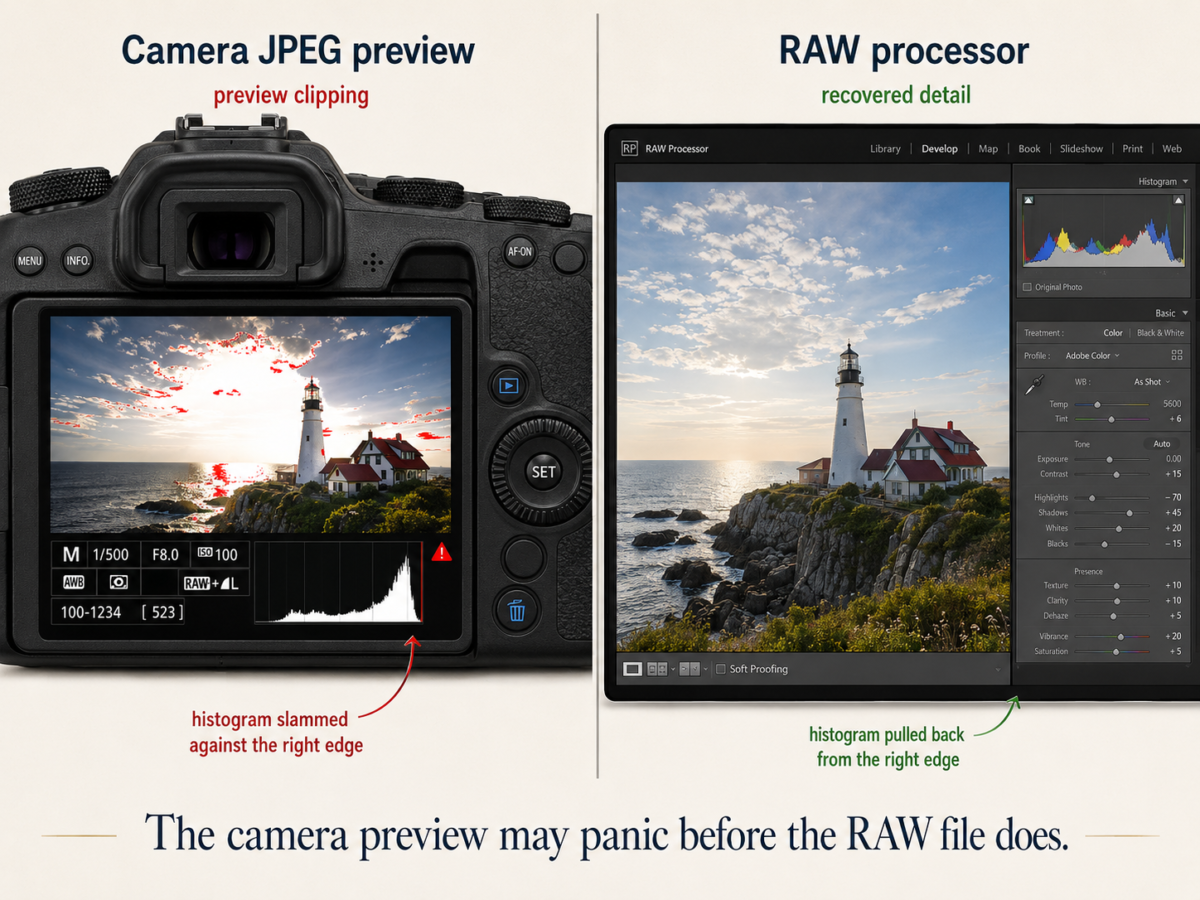
The histogram you see on the rear screen of most cameras is usually not generated from the untouched RAW sensor data. It is generated from the embedded JPEG preview. That means it already has the camera profile, contrast, saturation, white balance, and tone curve baked into the preview.
So yes, the rear-screen histogram can lie to you.
But it lies in a very specific way.
It may tell you the JPEG preview is clipping when the RAW file still has recoverable information. This is why photographers learned to “expose to the right.” Push the exposure as far as you safely can without destroying important highlights, because more exposure generally gives you cleaner shadows and better tonal information.
That principle is real.
But it has been turned into bad religion.
“Expose to the right” does not mean “drive the histogram into the guardrail and pray.”
It means place the exposure intelligently, knowing that the camera’s JPEG preview is often more conservative than the RAW file.
That gap is real.
But the gap is between the camera’s JPEG preview and what the RAW file can still render.
It is not a gap beyond the edge of the histogram where invisible information lives like buried treasure.
Once you are working in a RAW processor, the histogram is still a rendered interpretation of the RAW data, not a mystical X-ray of the sensor. Change the profile, white balance, contrast, exposure slider, or curve, and the histogram changes. That is because RAW is not a finished picture. It is negotiable evidence.
But even then, the fantasy of “five stops beyond the wall” is over.
You are now working with the image you have.
Not the one you wish the sensor had secretly hidden offscreen.
JPEG Shooters Get Less Mercy
If you shoot JPEG, the histogram matters even more.
With JPEG, the camera makes the processing decisions for you and bakes them into the file. White balance, contrast, sharpening, saturation, tone curve, compression – all of it gets cooked right there in the camera.
If the JPEG clips, it clips.
There is no deep RAW reservoir underneath it waiting to be drawn up from the well.
That does not mean JPEG is bad. JPEG can be wonderful when the exposure is right, the light is controlled, and the camera settings are doing what you want. But JPEG is less forgiving. It gives you less room to argue later.
RAW gives you more room to negotiate.
JPEG makes you live with the deal you signed in the field.
What You Should Actually Do With a Histogram
Read the histogram as a description.
Not a verdict.
Look at where the data lives and ask one simple question:
Does this distribution make sense for the photograph I intended to make?
A night scene should lean left.
A high-key snow photograph should lean right.
A portrait in soft window light may make a beautiful fat middle.
A silhouette may clip shadows on purpose.
A photograph of the sun glinting off chrome may clip a specular highlight and nobody should lose sleep over it.
The histogram tells you something clipped.
The photograph tells you whether it matters.
That distinction is everything.
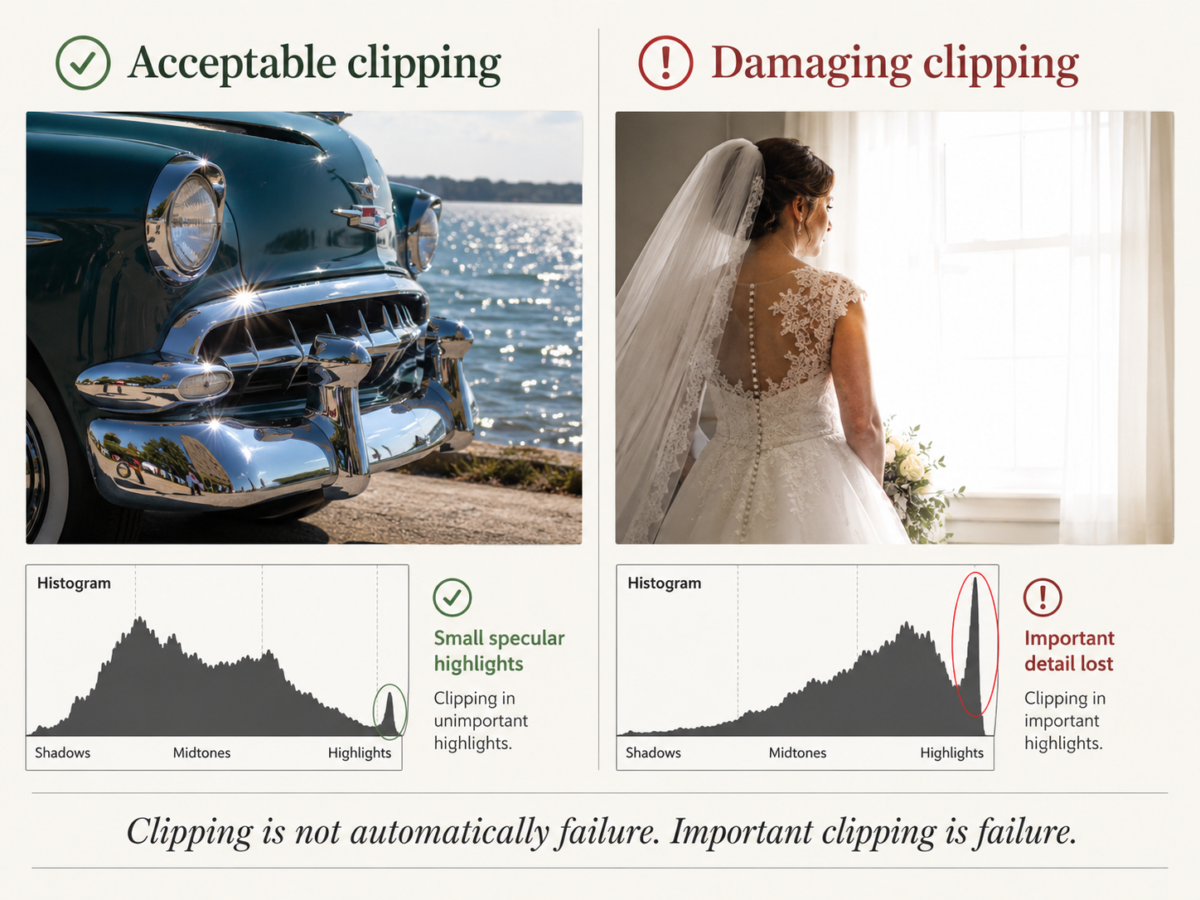
If the curve slams into the right wall, do not panic. Ask what is clipping.
If it is the sun, a bare light bulb, or a tiny specular reflection on water, congratulations. You have photographed reality. Some things in the world are brighter than your file can politely contain.
But if the spike is the bride’s dress, a white horse, an adobe church wall, or the clouds you thought were the whole point of the photograph, then yes, you have a problem.
The same thing applies on the left.
If a shadow falls to black and you intended mystery, depth, or drama, fine. Let it go black. The old masters were not afraid of black. Neither should you be.
But if the left wall is eating the only important detail in the picture, then you underexposed the part of the photograph that mattered.
That is not the histogram’s fault.
It told you.
You just did not listen.
The Histogram Is Honest, But It Is Not Wise
The histogram is one of the most honest tools we have in digital photography.
It does not flatter you.
It does not care what camera you bought.
It does not care whether the lens was expensive, whether the scene was beautiful, whether you hiked three miles, or whether the light made you feel like God had personally opened a softbox over northern New Mexico.
It tells you what is in the file.
That is all.
And that is enough.
The mistake is asking it to do more than that.
The histogram cannot tell you whether the photograph is emotionally true. It cannot tell you whether the composition works. It cannot tell you whether the gesture matters, whether the light sings, whether the frame breathes, or whether the picture deserves to live.
That part is still on you.
Photography has always been a negotiation between measurement and meaning.
The meter gives you numbers.
The histogram gives you evidence.
The camera gives you a file.
But the photograph?
The photograph is still your responsibility.
And thank God for that.
©2026 Charles Paul Jones. All Rights Reserved.
